
Use Cases
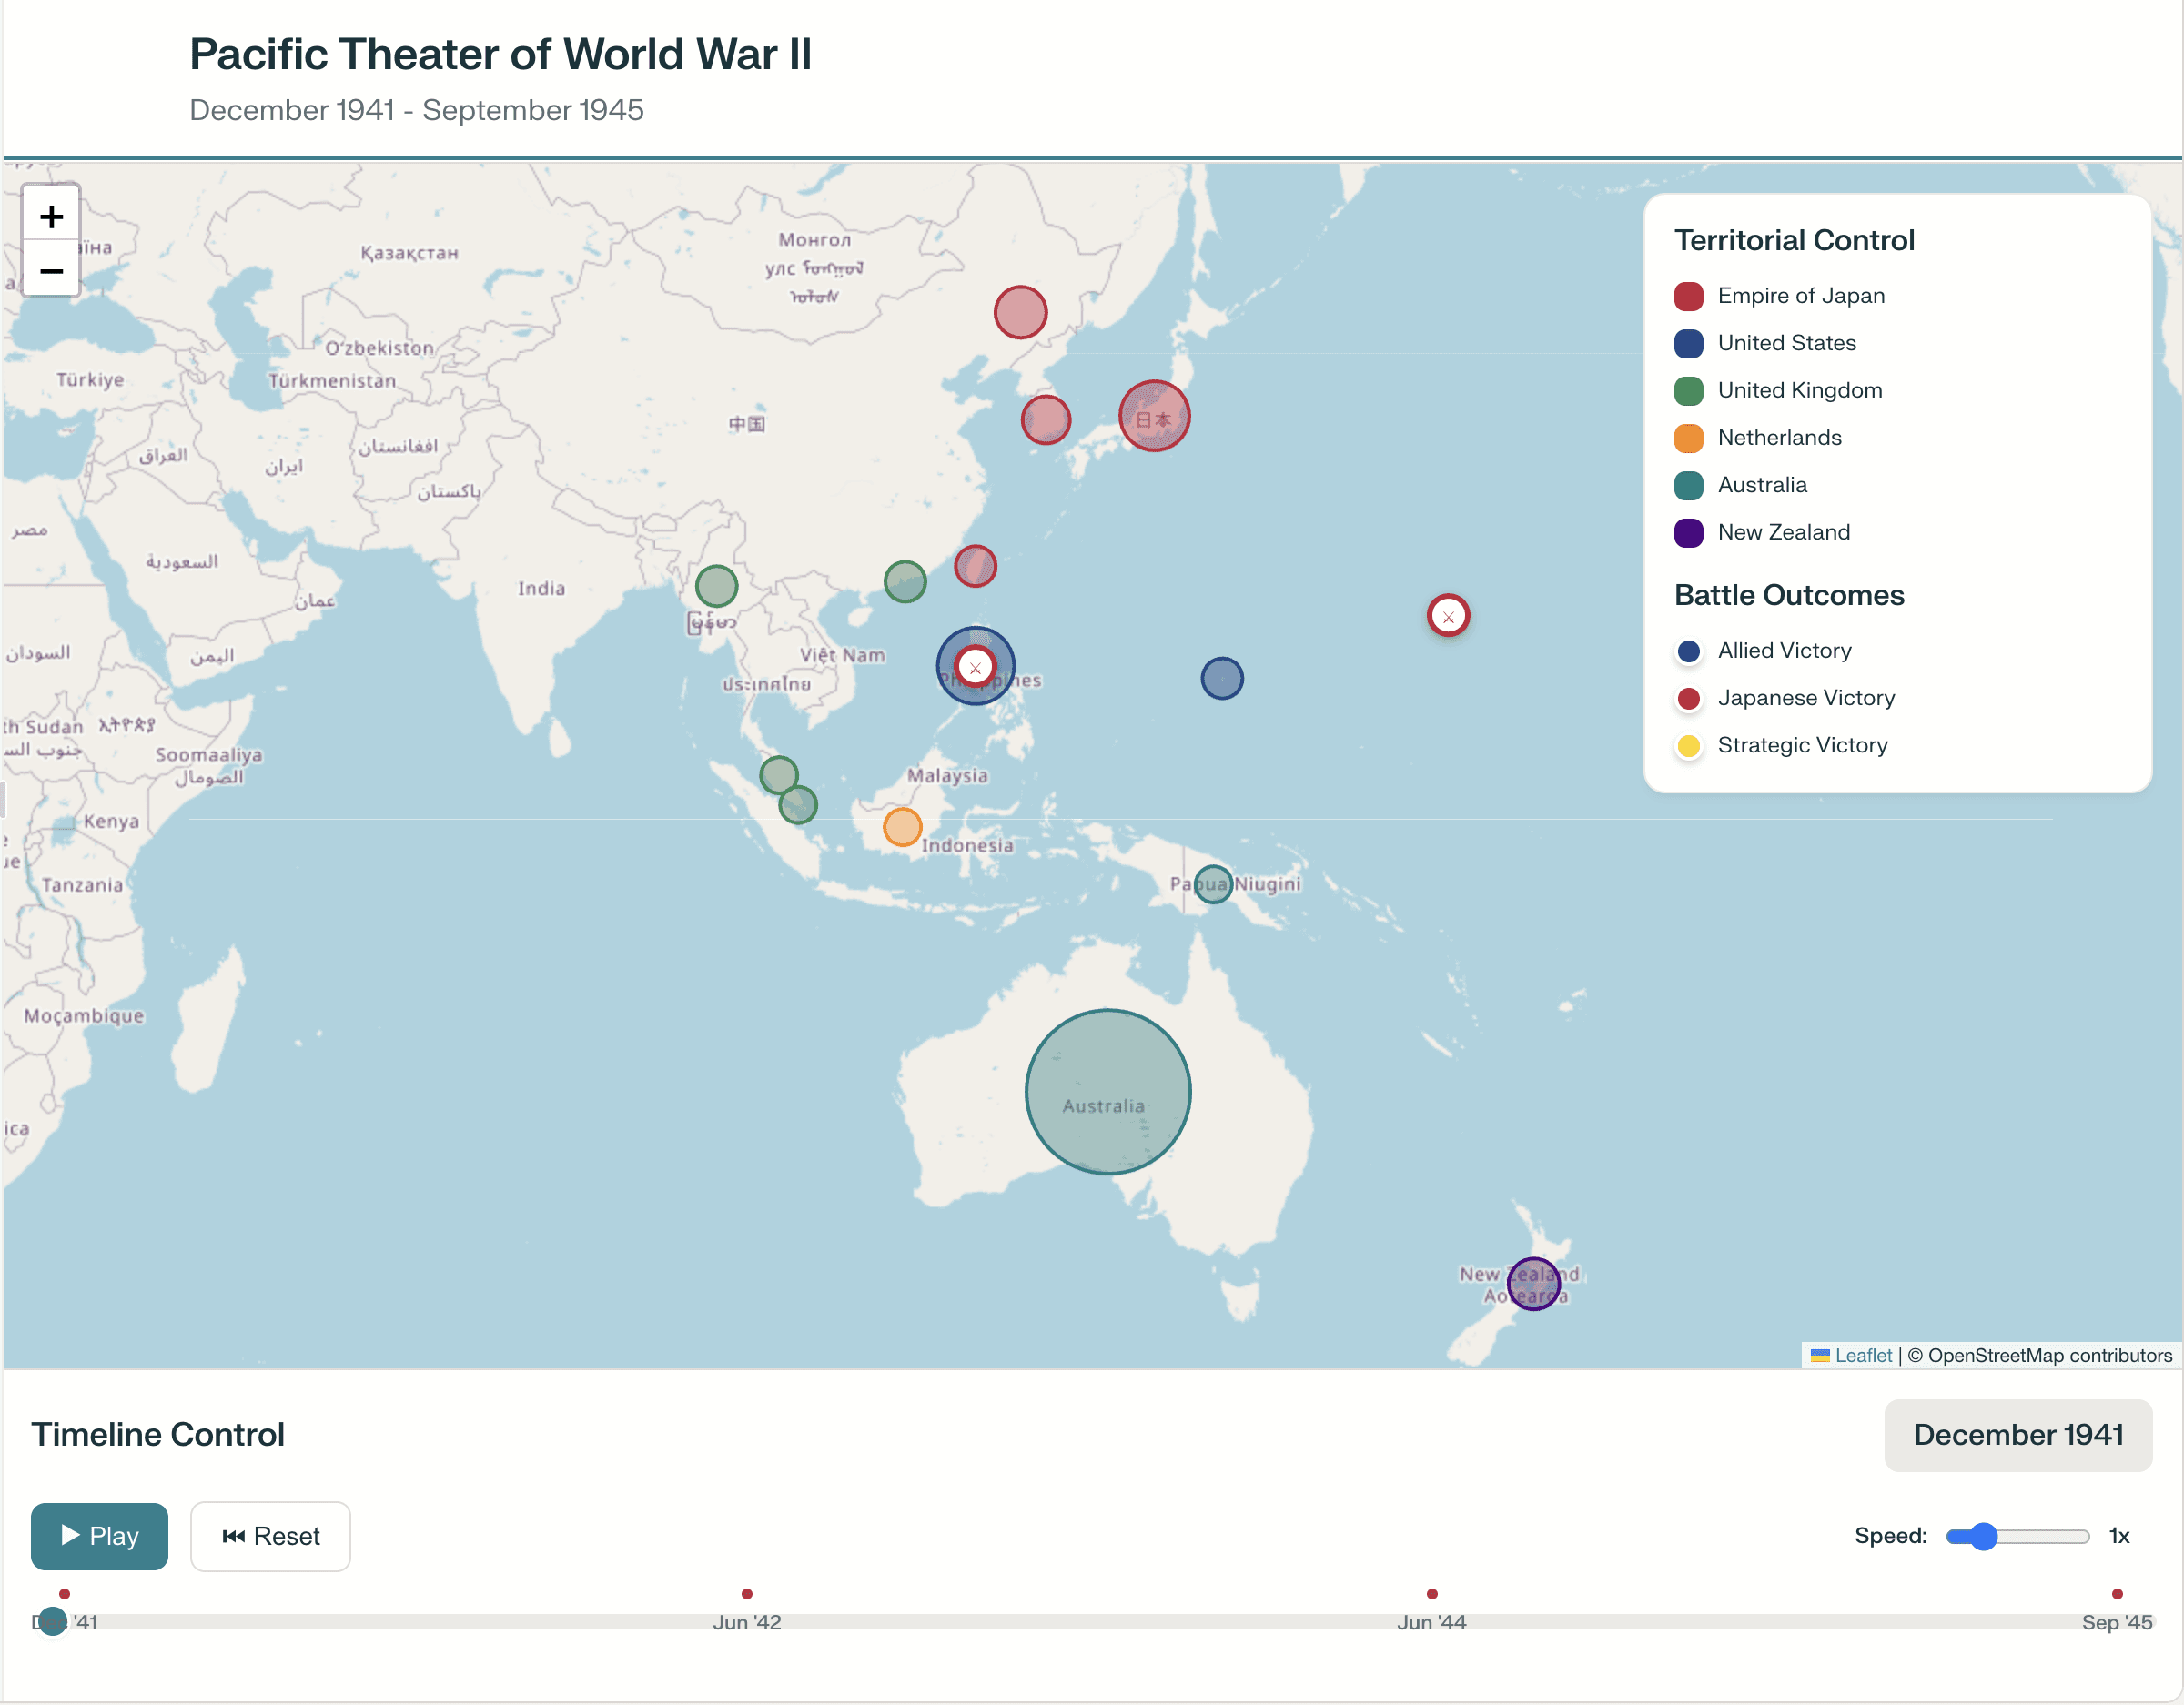
Create interactive historical maps
Features
Categories
Overview
Perplexity can act as a research assistant, data modeler, and technical spec writer in one place. It helps you define the scope, gather sources, structure the dataset, and even outline how to build an interactive map with time and territory controls.
Your search
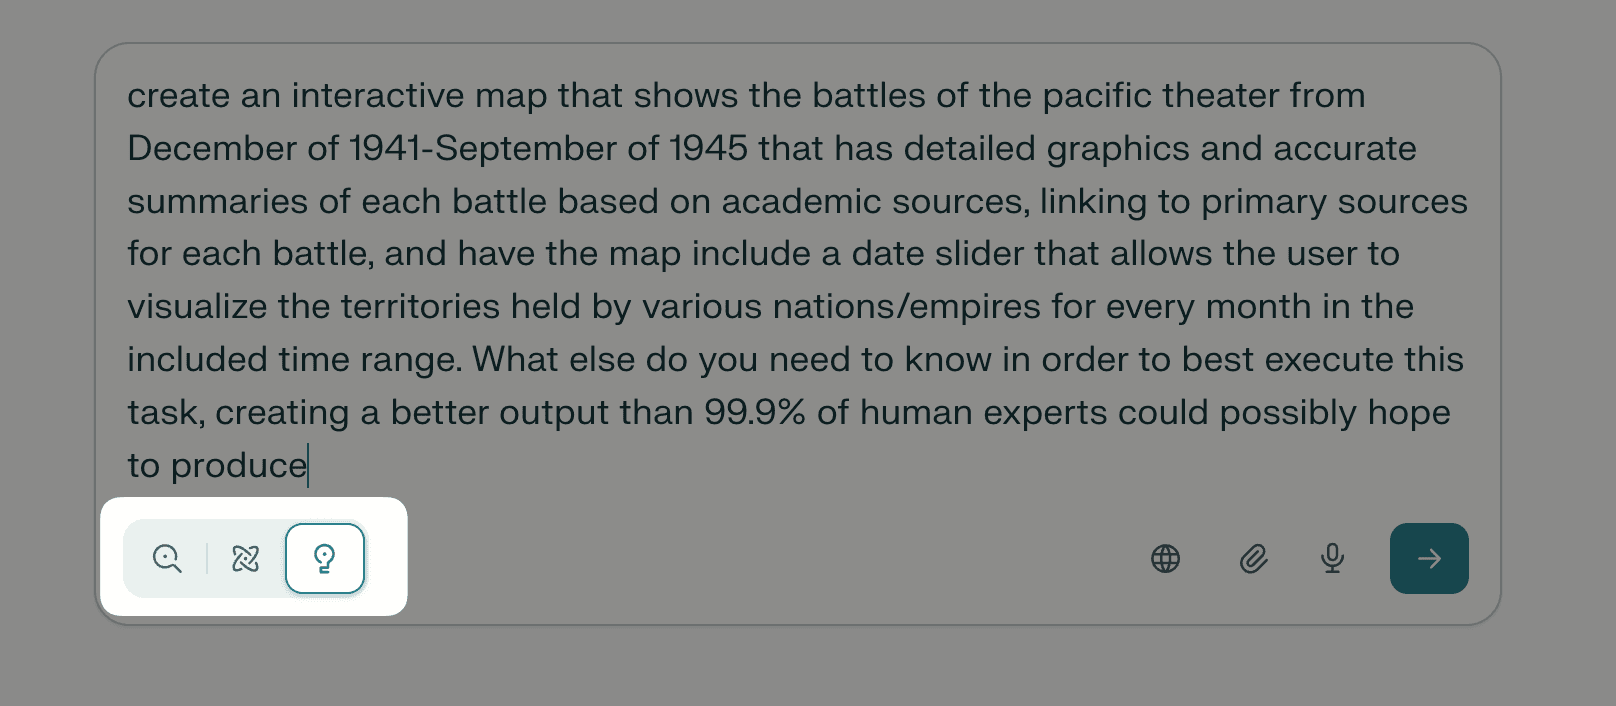
Describe your vision in natural language, including the time range, geographic scope, and interaction patterns you want (for example, a monthly date slider).
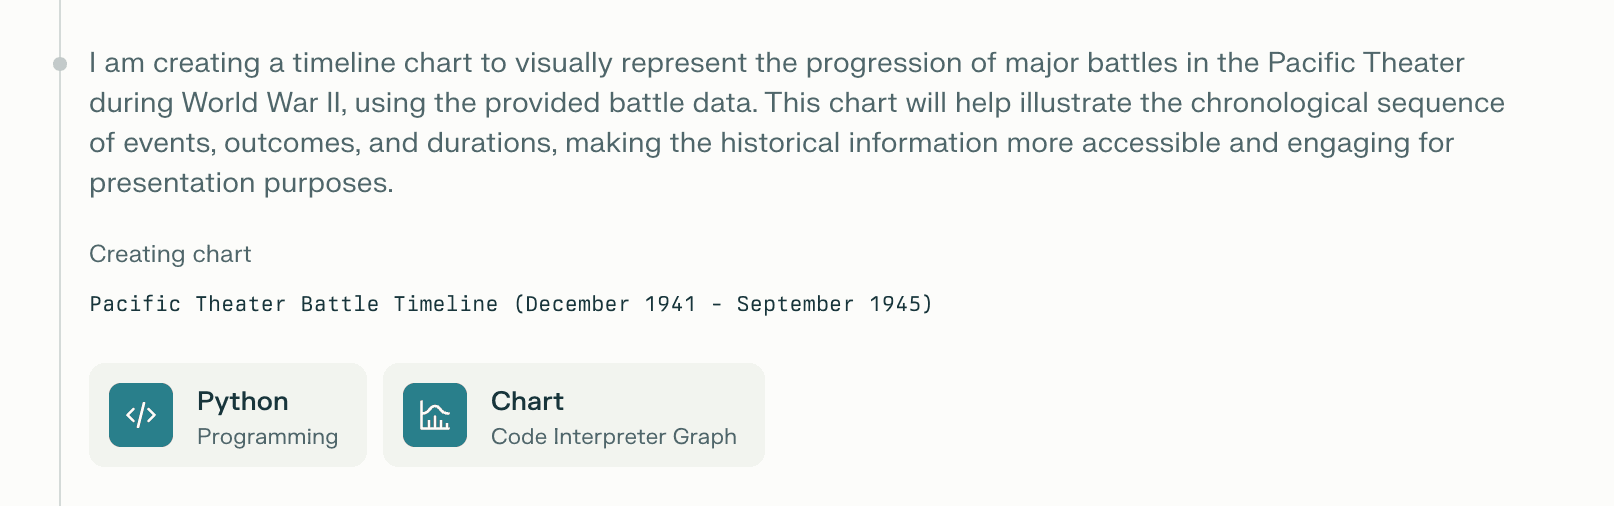
Create an interactive map that shows the battles of the pacific theater from December of 1941-September of 1945 that has detailed graphics and accurate summaries of each battle based on academic sources, linking to primary sources for each battle, and have the map include a date slider that allows the user to visualize the territories held by various nations/empires for every month in the included time range. What else do you need to know in order to best execute this task, creating a better output than 99.9% of human experts could possibly hope to produce
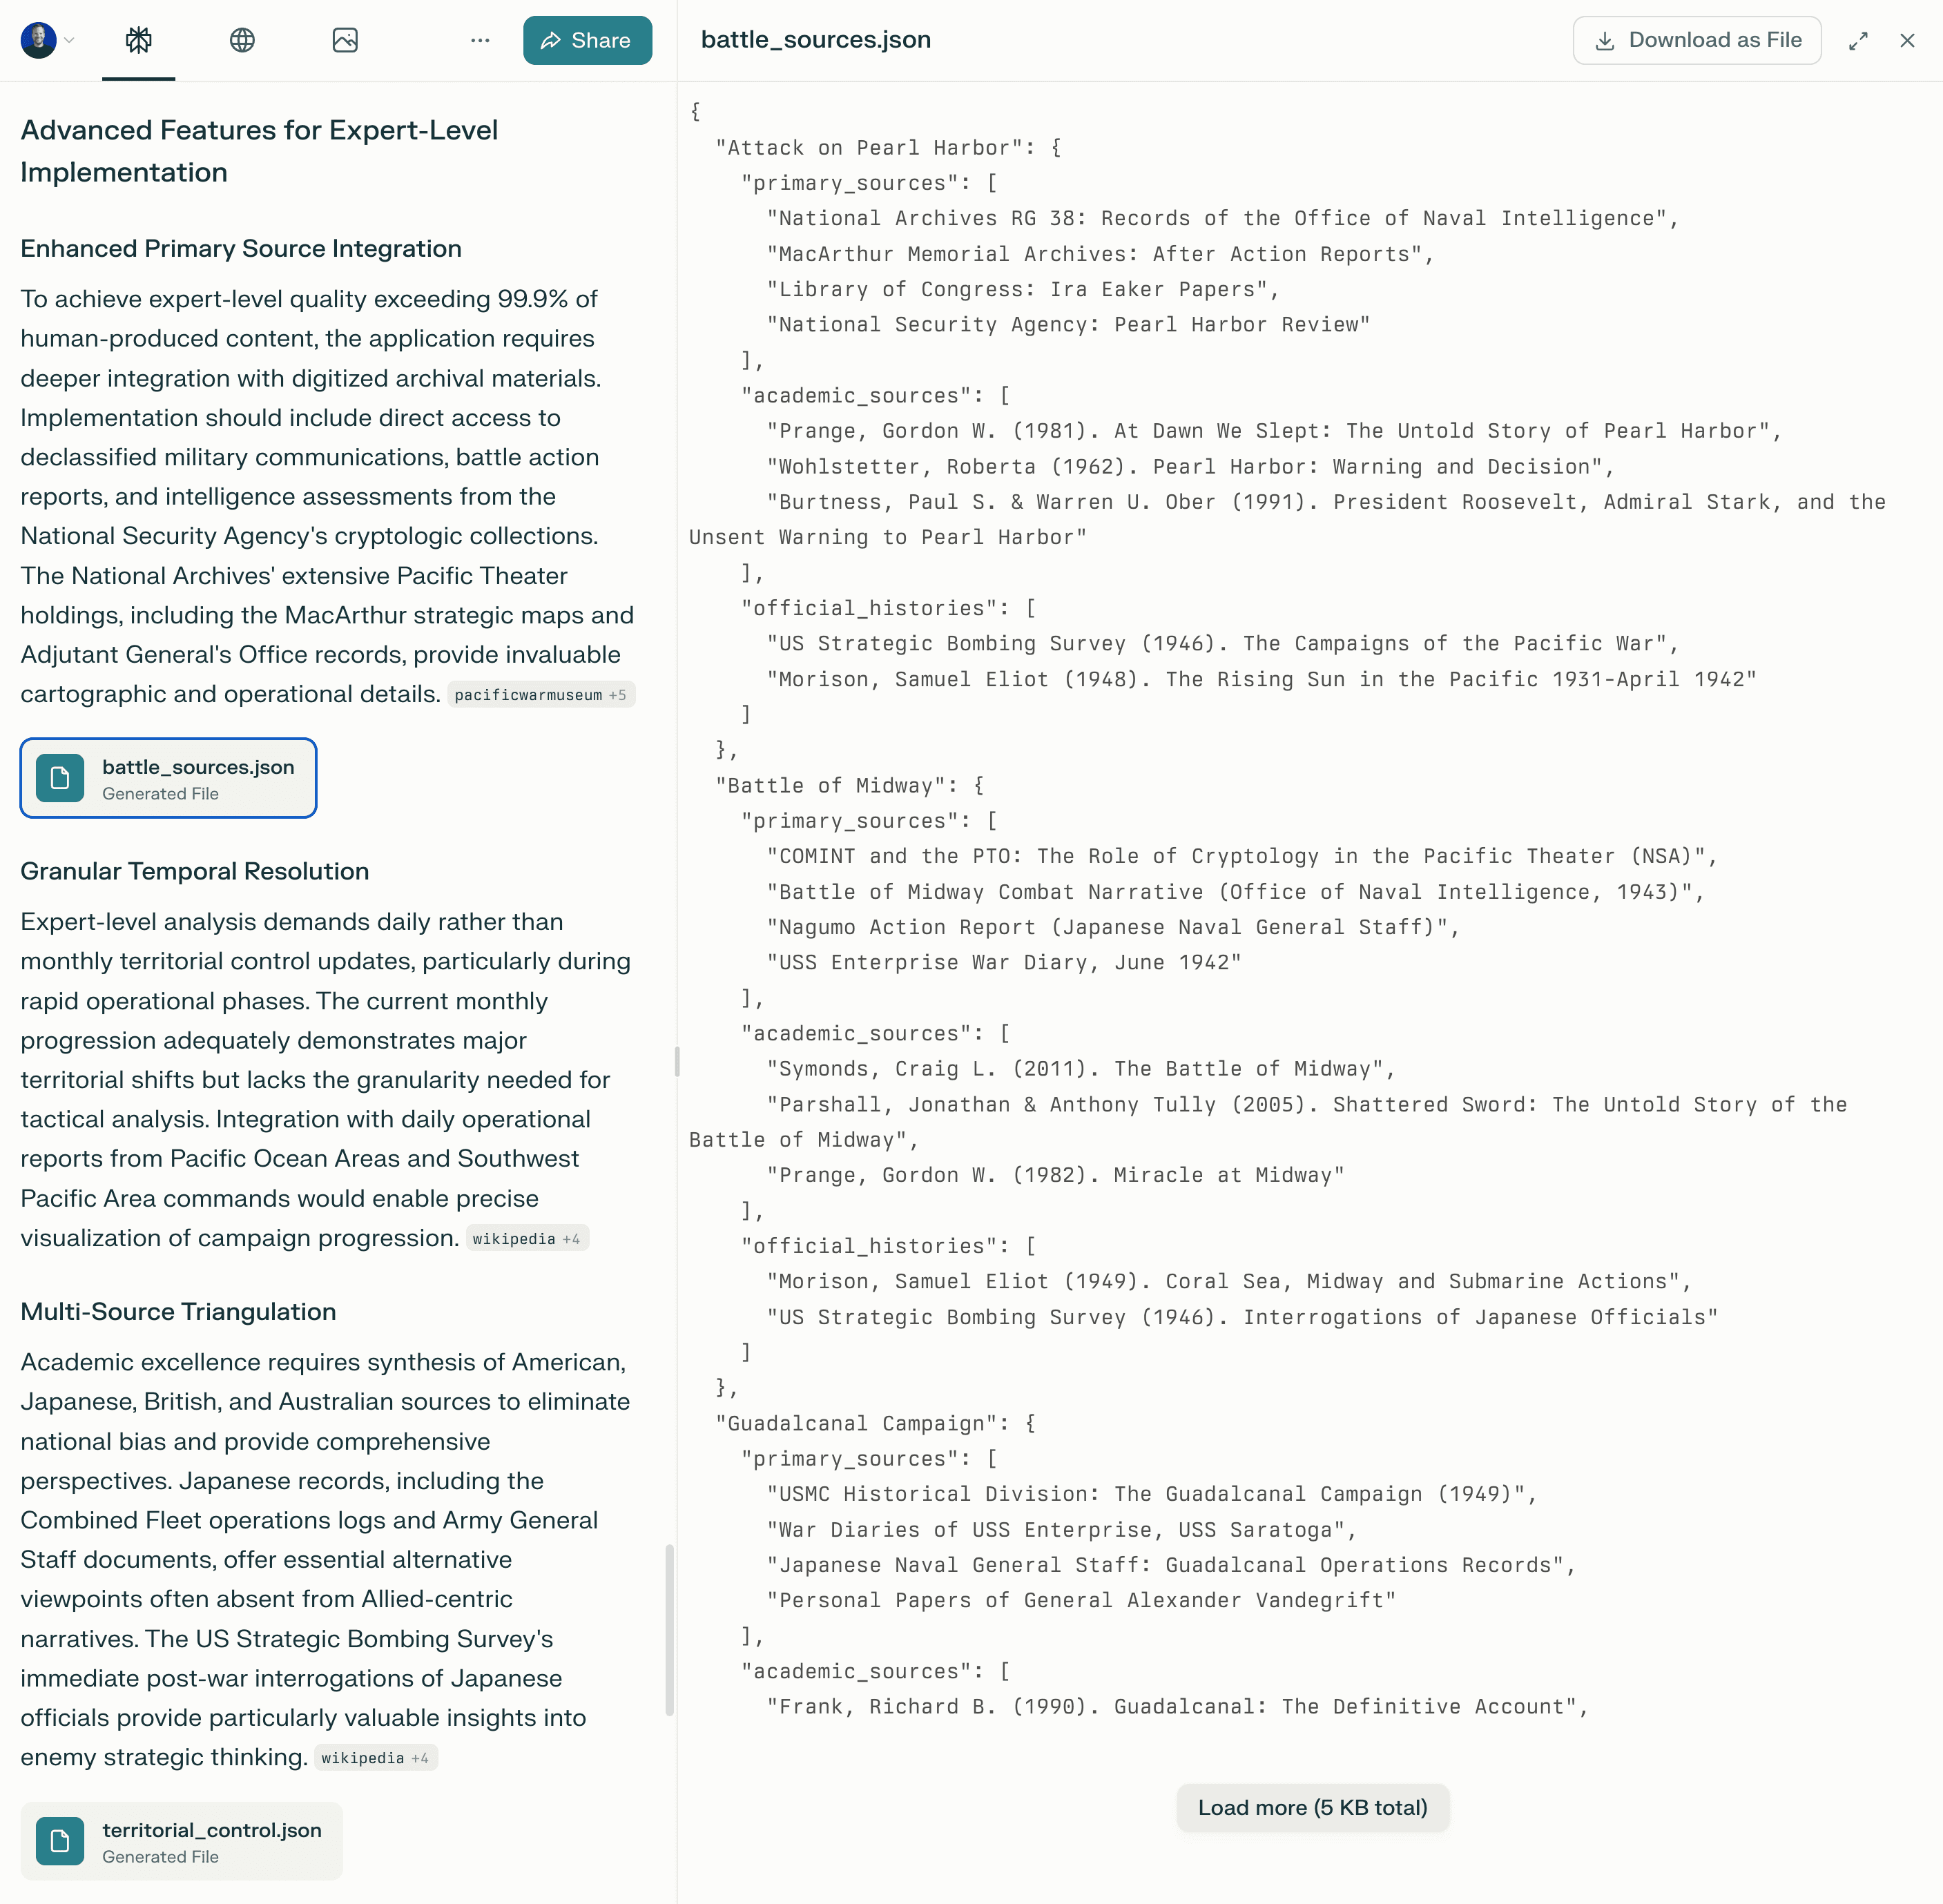
Use ‘Labs’ to generate artifacts such as interactive data visualizations, images, applications, and files.
Perplexity's answer
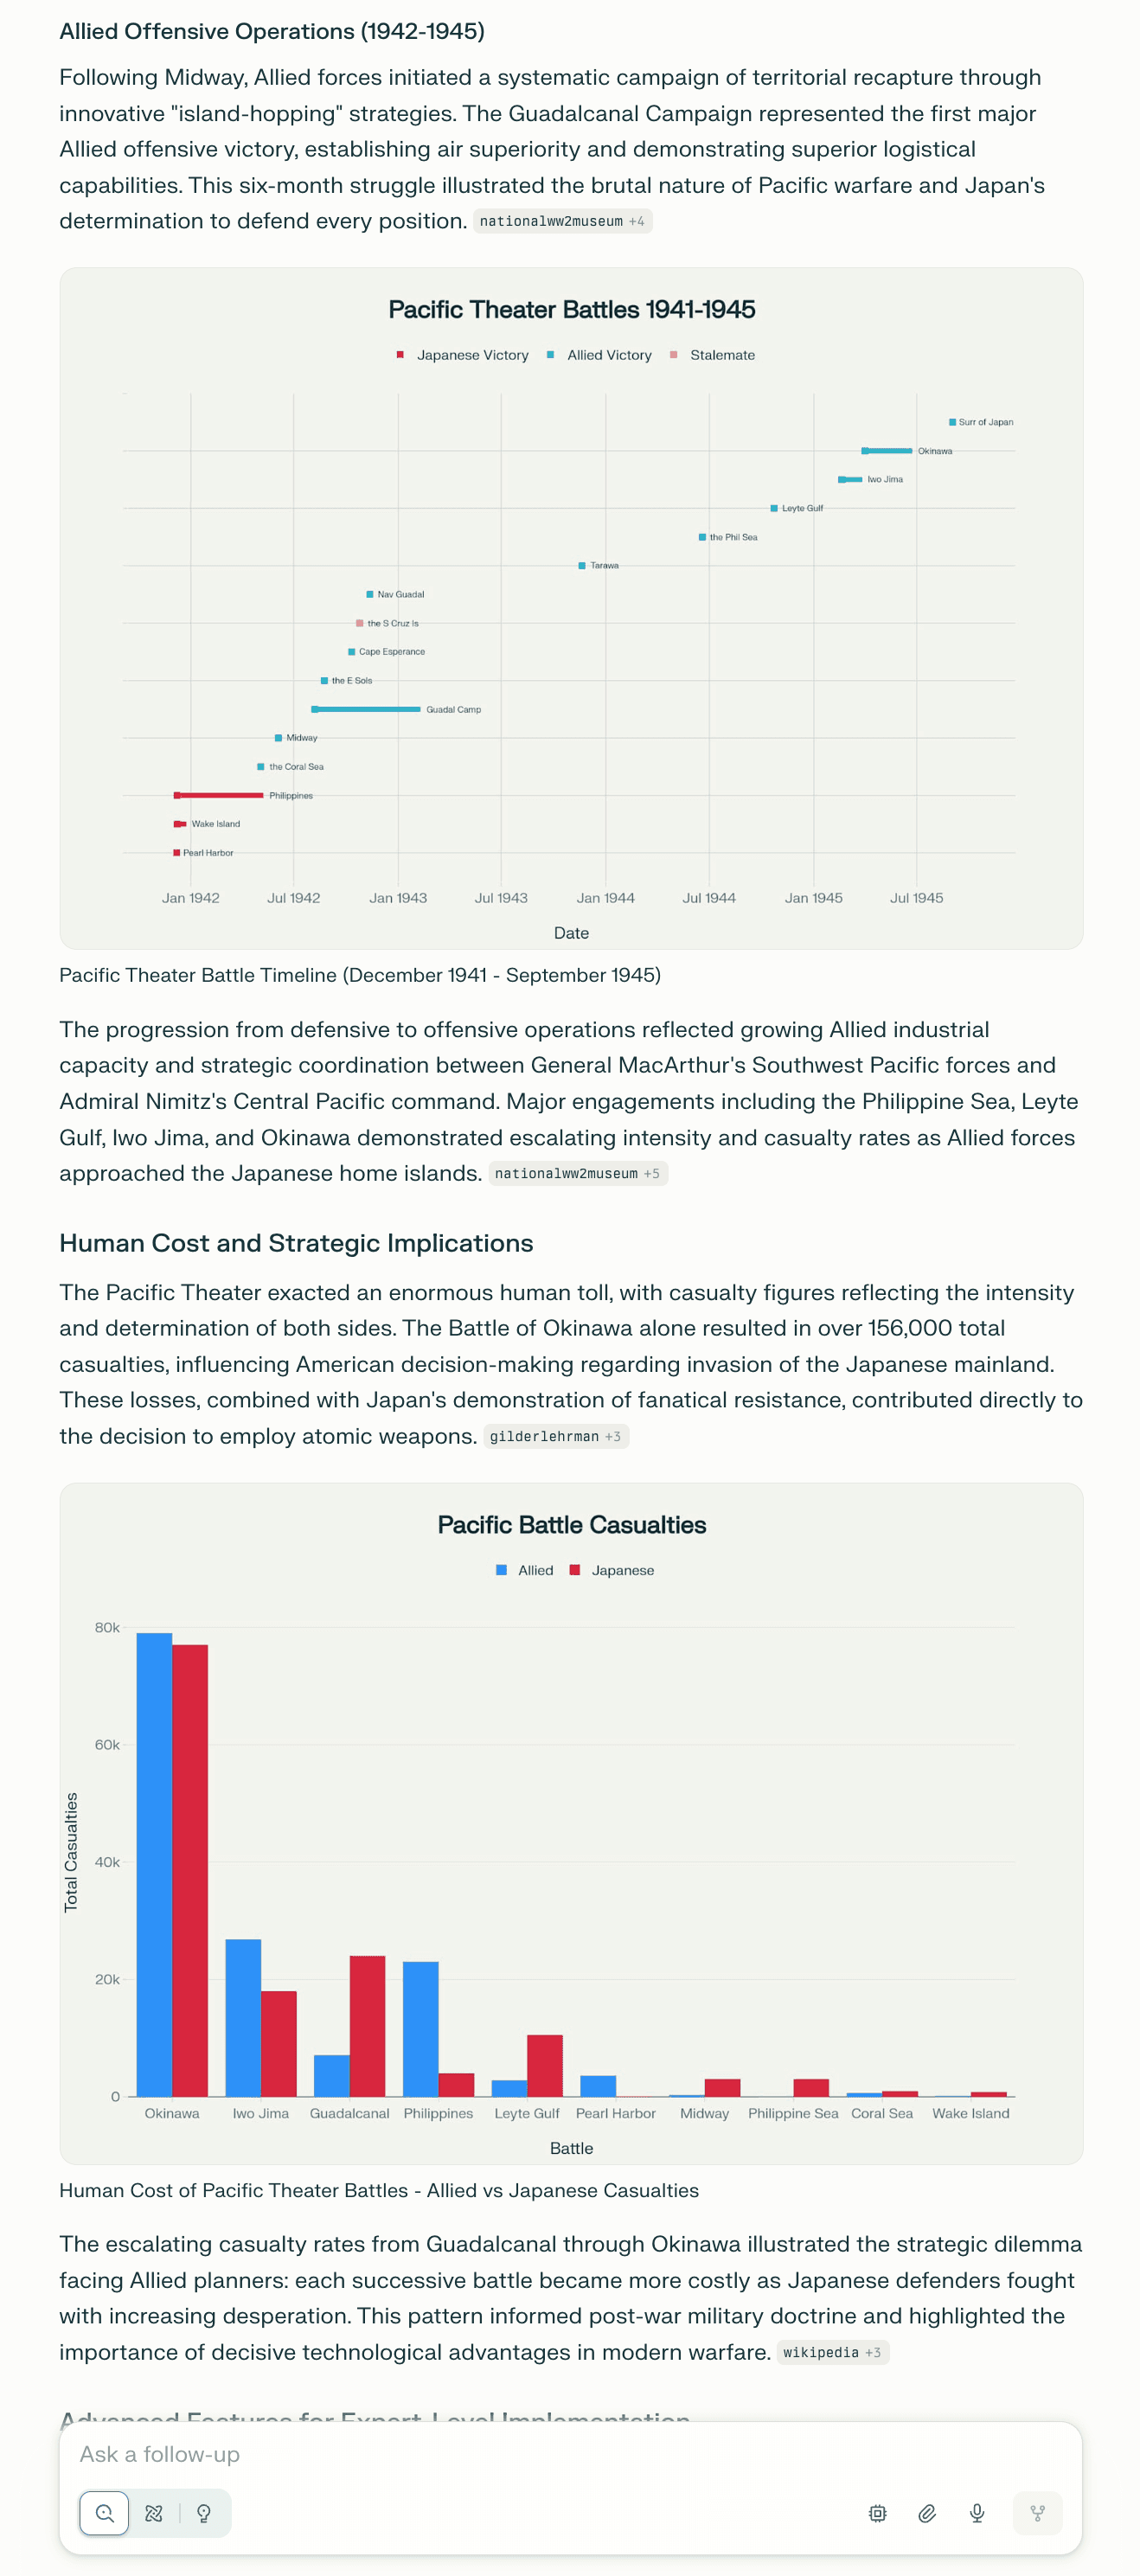
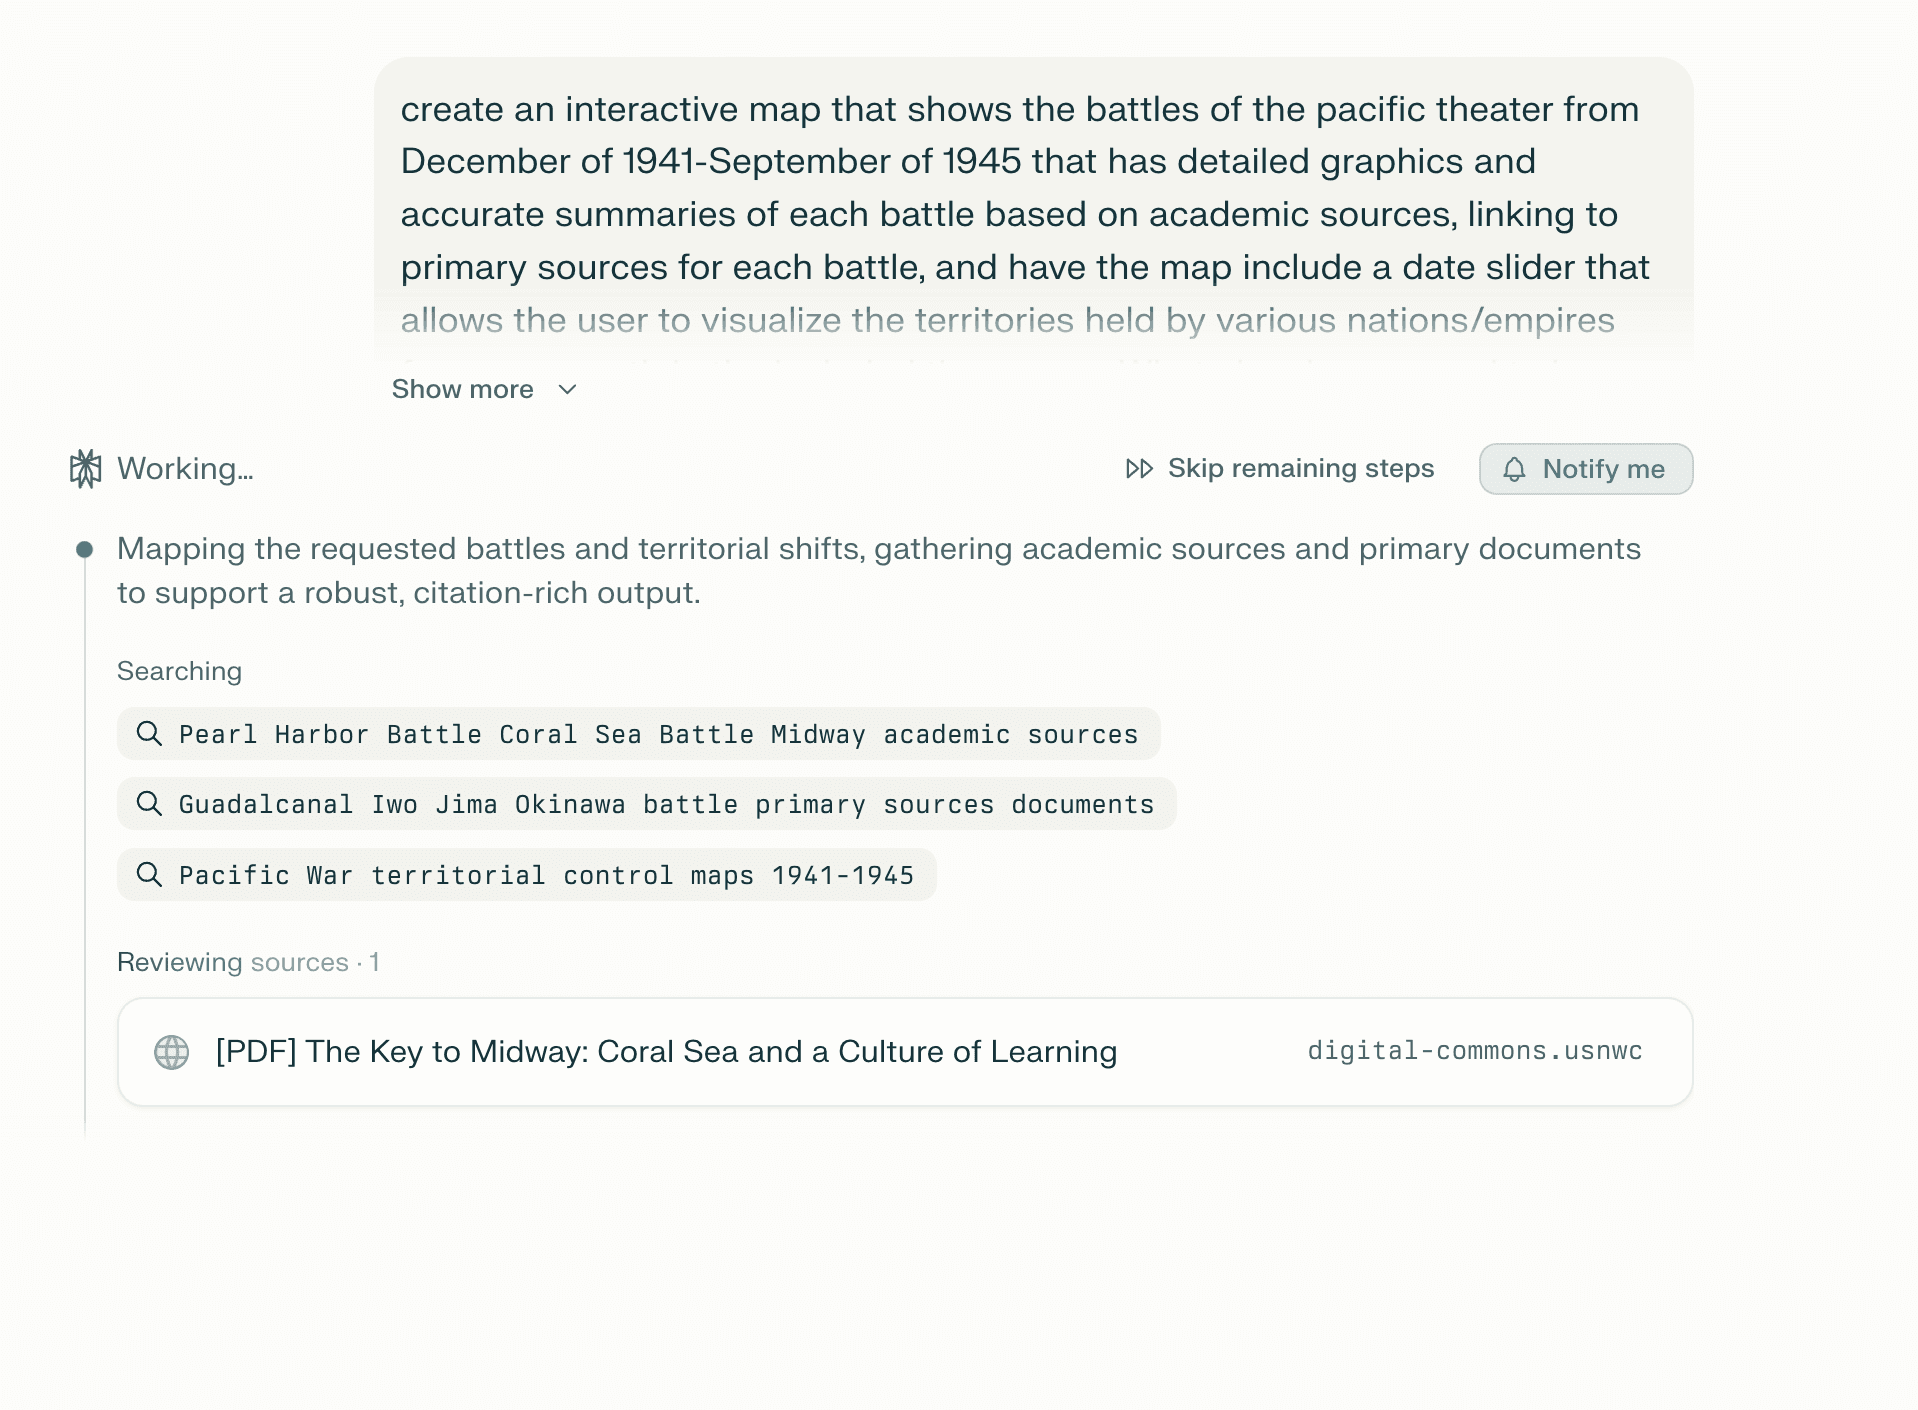
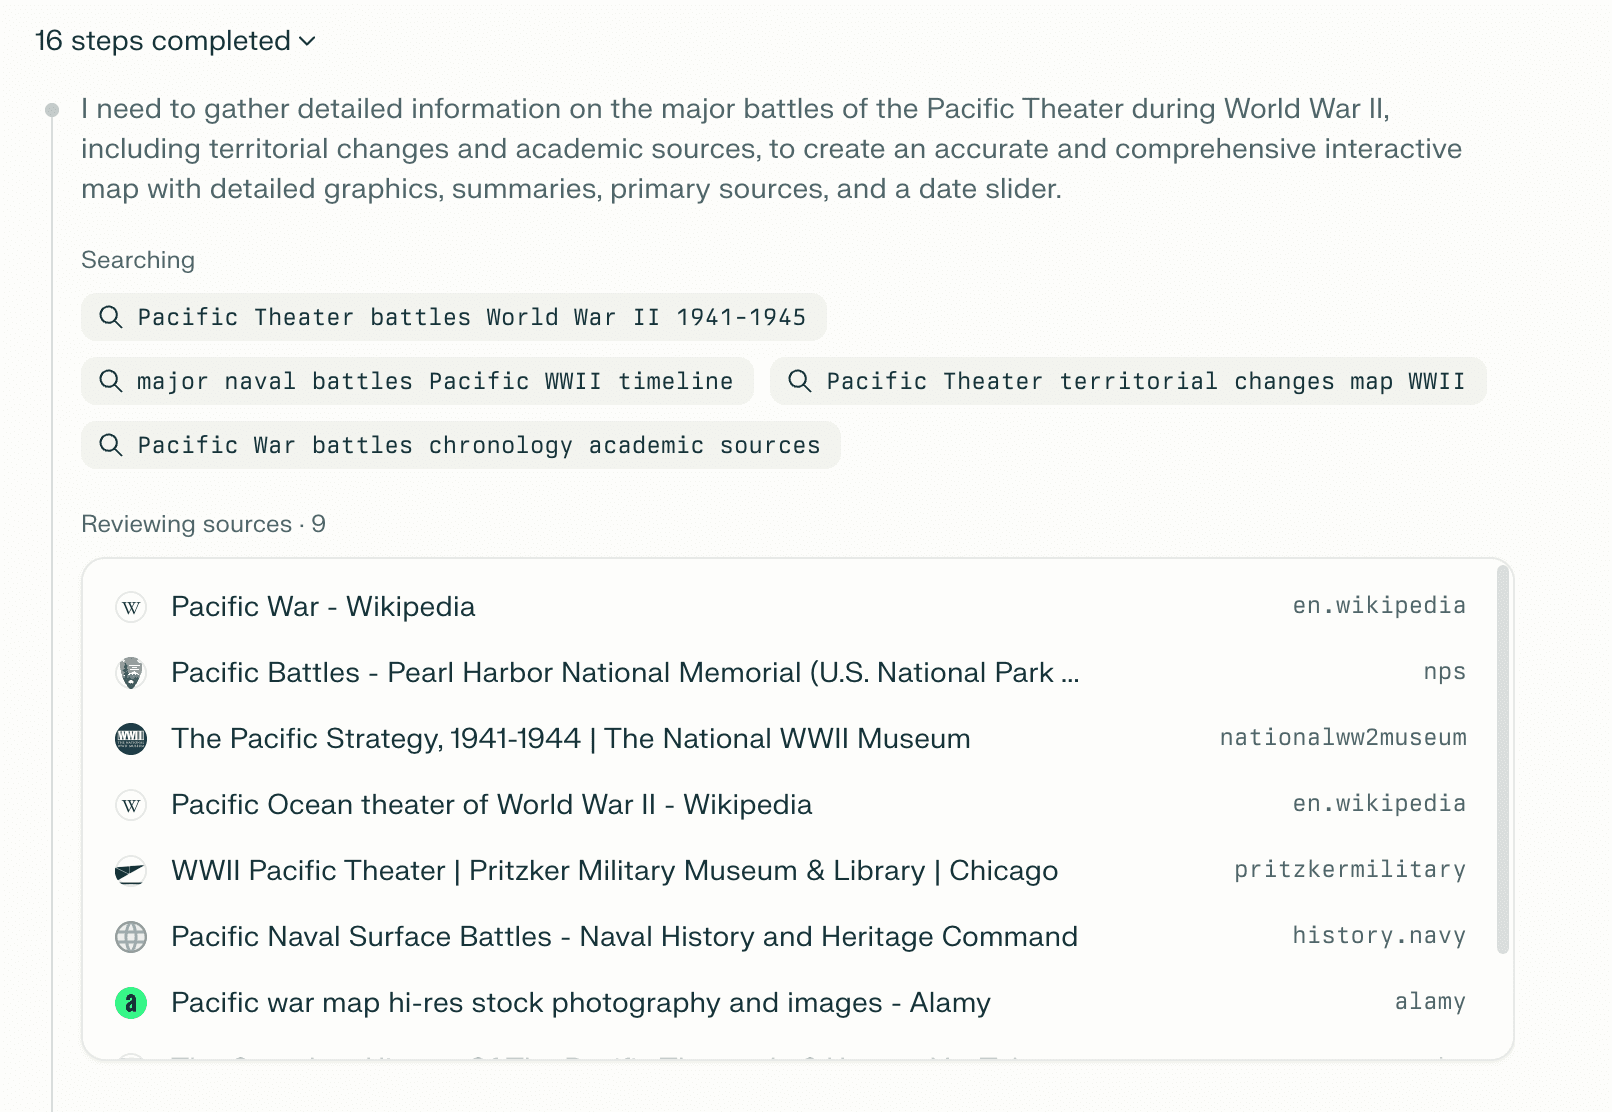
Perplexity generates a structured research plan that outlines datasets to collect, key academic sources to reference, primary source archives to consult, and clear validation steps. It produces schemas for the data you’ll need and constructs visualizations and examples to help you see how the information will fit together. Its sources include links to digitized archives, government documents, and museum collections.